Kueue Metrics Dashboard
Monitor Kueue Metrics
To view the dashboard, go to the Kueue Metrics dashboard.
Info
For accessing CoreWeave Grafana Dashboards instructions, see Access CoreWeave Grafana Dashboards.
The Kueue dashboard provides an overview Kueue's metrics related to workload admissions, cluster queue status, and resource Reservations. The dashboard also tracks admission latencies and wait times for workloads.
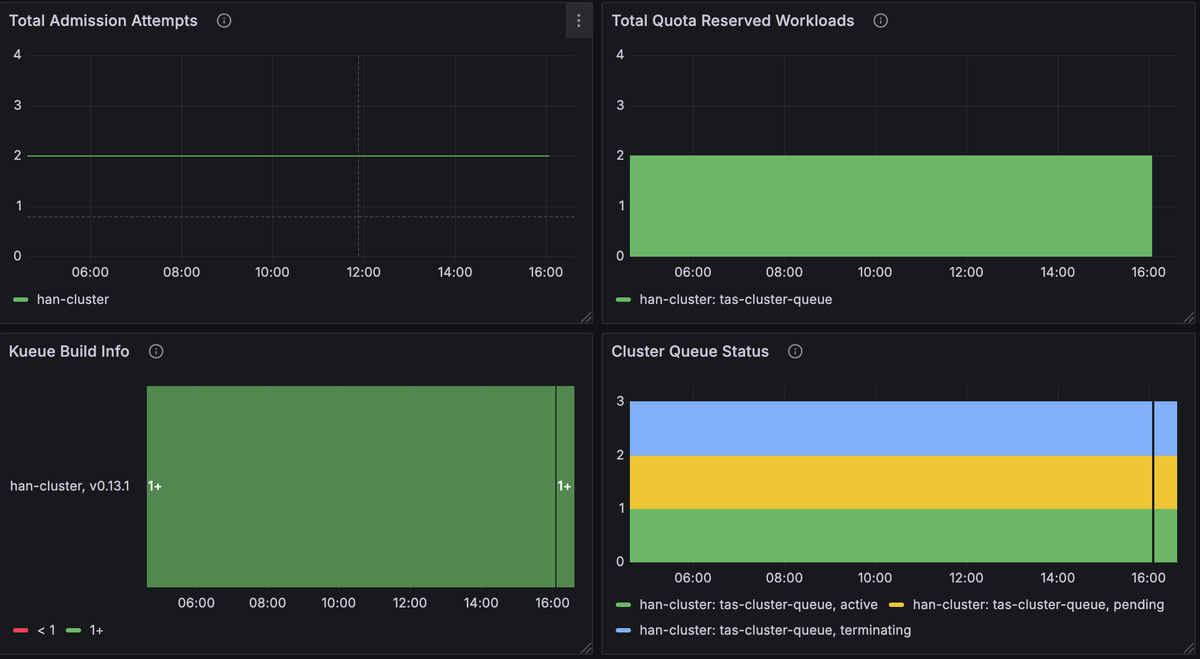
The Kueue dashboard contains the following panels:
| Panel | Description |
|---|---|
| Total Admission Attempts | Displays a count of the total attempts to admit workloads. |
| Admission Attempt Latency | Shows a histogram of the time it takes for admission attempts to complete. |
| Kueue Build Info | Shows build and version information for Kueue. |
| Pending Workloads | Displays the number of workloads waiting to be admitted. |
| Total Quota Reserved Workloads | Shows the total count of workloads that have successfully reserved their required quota. |
| Cluster Queue Status | Shows an overview of the status of the various queues in the cluster. |
| Total Admitted Workloads | Shows a cumulative count of all workloads that have been admitted. |
| Admitted Active Workloads | Displays the number of admitted workloads that are currently in an active or running state. |
| Reserving Active Workloads | Shows the count of active workloads that are in the process of reserving quota. |
| Quota Reserved Wait Time | Shows the time workloads spend waiting for their quota to be reserved. |
| Total Unique Workload Evictions | Displays the number of distinct workloads that have been evicted. |
| Total Evicted Workloads | Shows a cumulative count of all workload evictions. |
| Admission Checks Wait Time | Displays a histogram of the time spent waiting for admission checks to complete. |
| Admission Wait Time | Shows a histogram of the total time workloads wait to be admitted. |
| Admission Cycle Preemption Skips | Shows the number of times preemption was skipped during an admission cycle. |
| Total Preempted Workloads | Displays a cumulative count of all workloads that have been preempted. |