Control Plane Metrics
Monitor Control Plane Metrics
To view the dashboard, go to the Control Plane Metrics dashboard.
For accessing CoreWeave Grafana Dashboards instructions, see Access CoreWeave Grafana Dashboards.
The Control Plane Metrics dashboards provide insights into your CKS Control Planes. The following provides an explanation for the panels in each of the following panel groups:
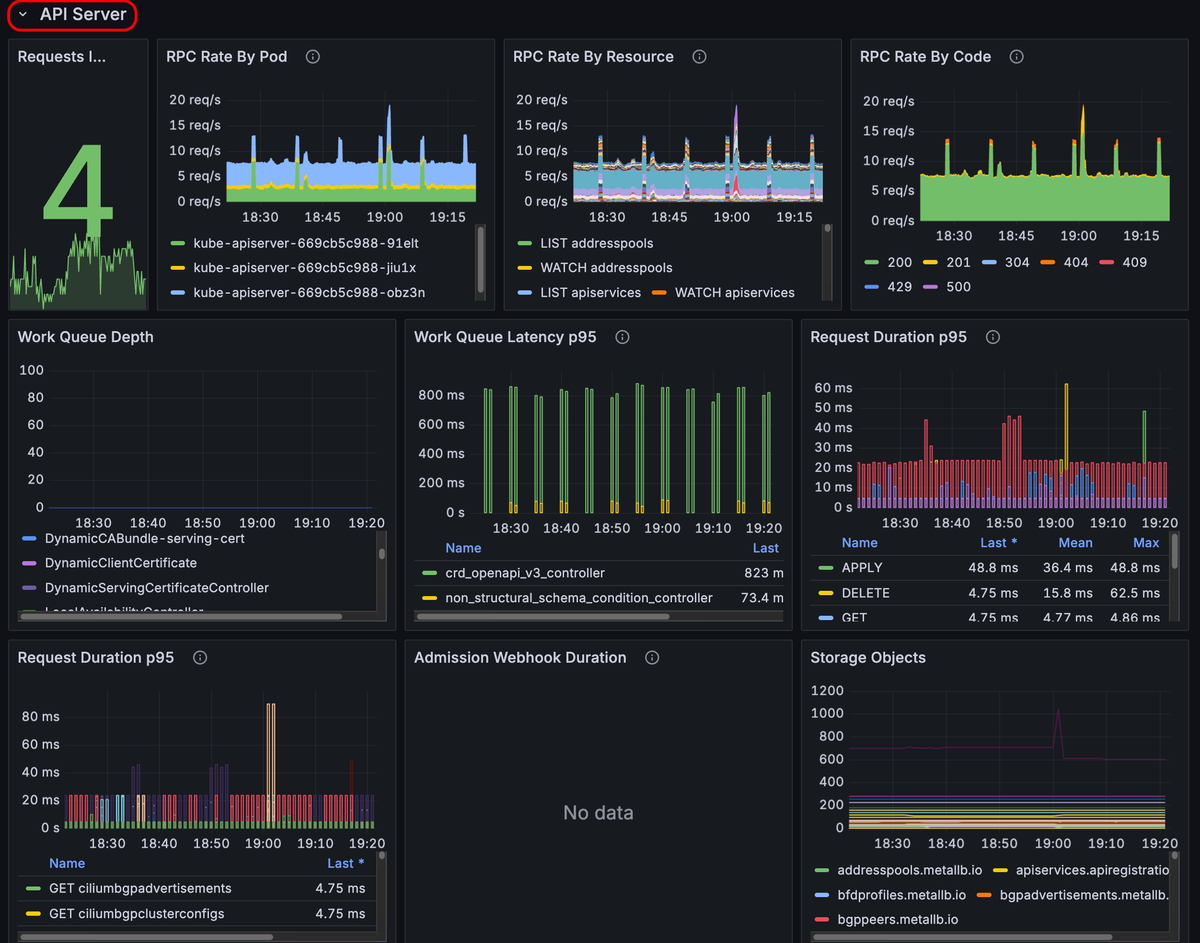
API Server
The API server panels provide real-time monitoring of the your API server's performance and health. The panels show metrics related to request rates, latencies, CPU usage, and memory usage.
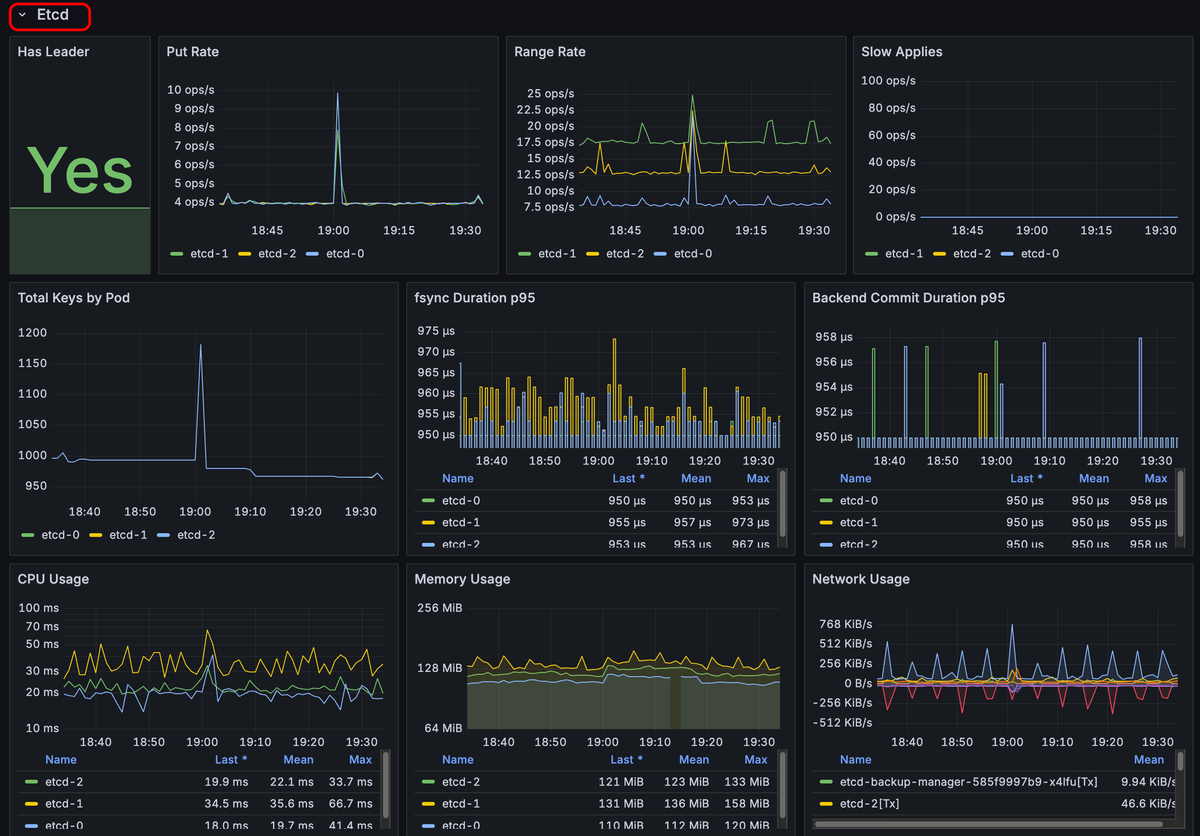
Etcd
The etcd panels show the performance and health of the etcd cluster. The panels show metrics such as put rates, range rates, synchronization durations, CPU usage, and memory usage.
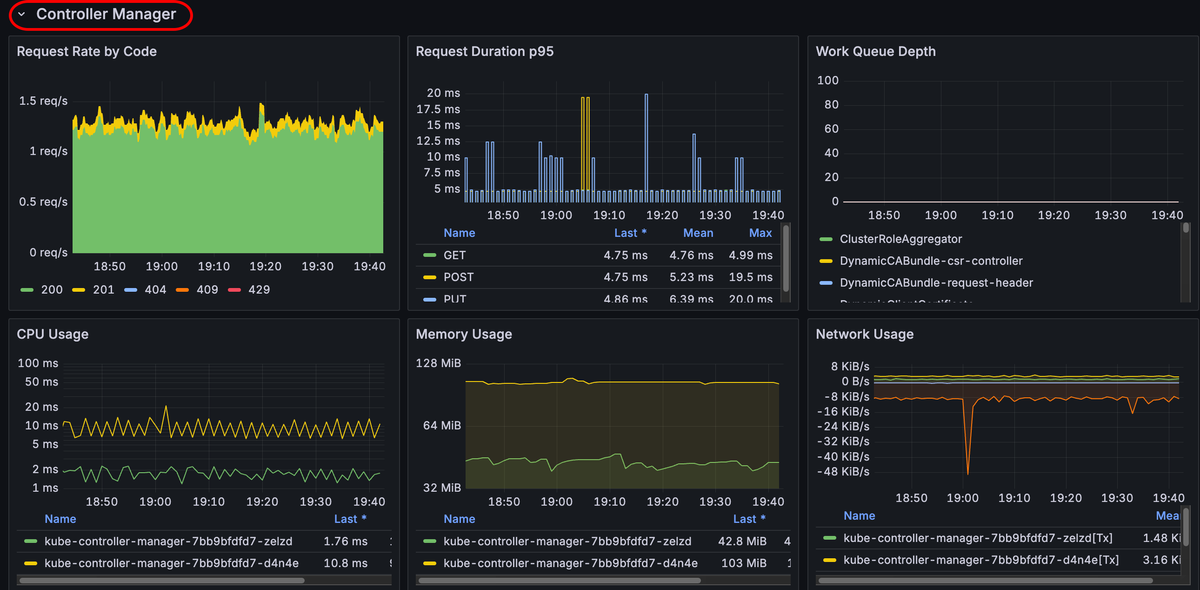
Controller Manager
The Controller Manager panels show the performance and resource utilization of the Kubernetes controller manager. The panels display metrics like request rates and durations, CPU usage, and memory usage.
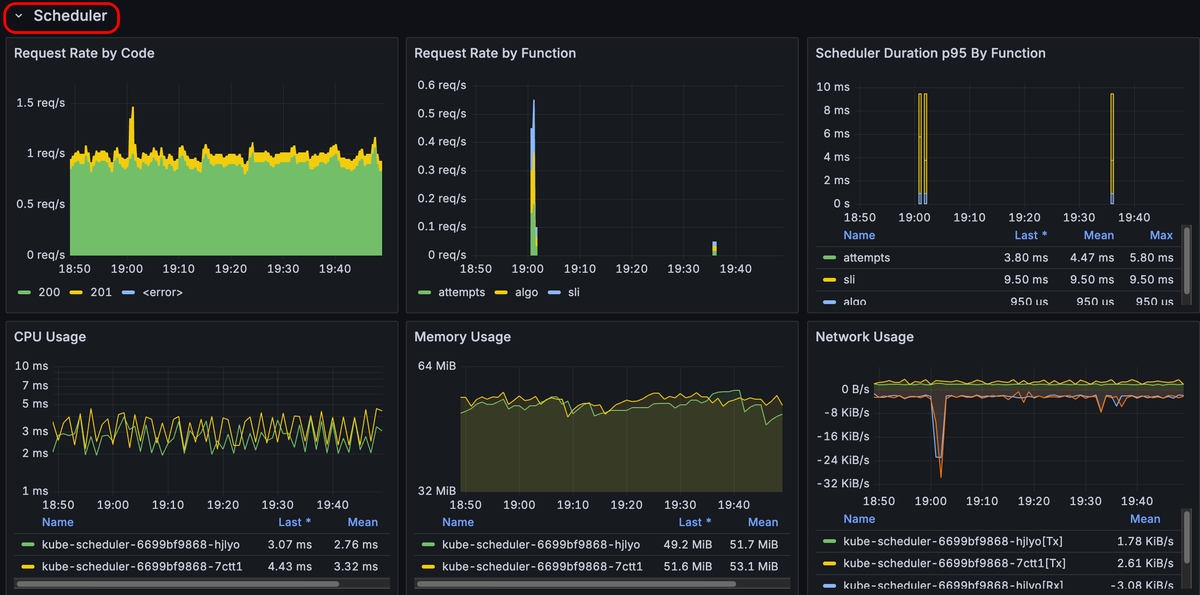
Scheduler
The Scheduler panels show metrics related to request rates, scheduling durations, and resource usage like CPU and memory.
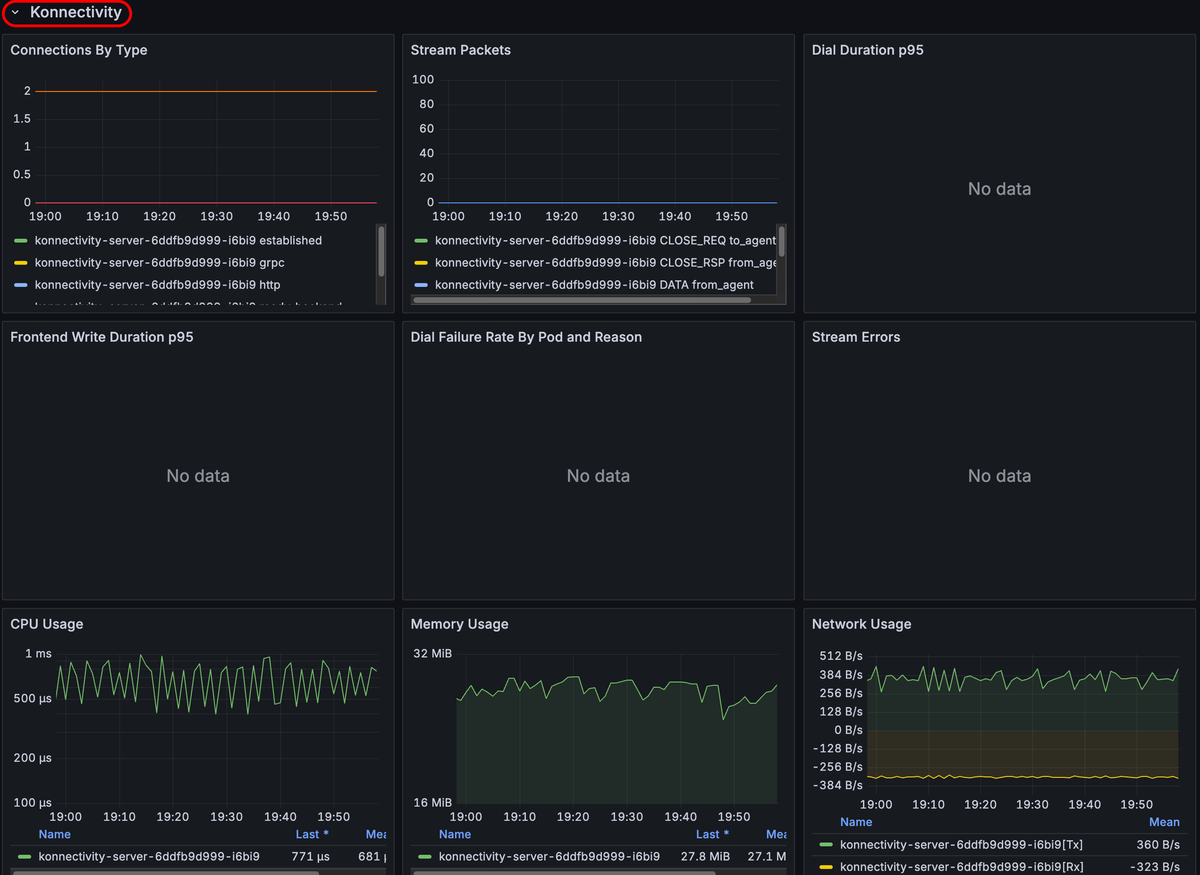
Konnectivity
The Konnectivity panels show metrics related to network connectivity and communication within the cluster, such as the number of established connections, stream packets, dial durations, and CPU and memory usage for connectivity-related components.