Get Started with Cloud UI
Manage your resources and organizations with the Cloud UI
What is the Cloud UI?
The CoreWeave Cloud UI is CoreWeave's resource and organization management platform at cloud.coreweave.com. Here, nearly all organization resources and account settings are managed from visual dashboards, each of which make it easy to deploy or manage resources or make changes to the organization and its users.
Cloud UI dashboard
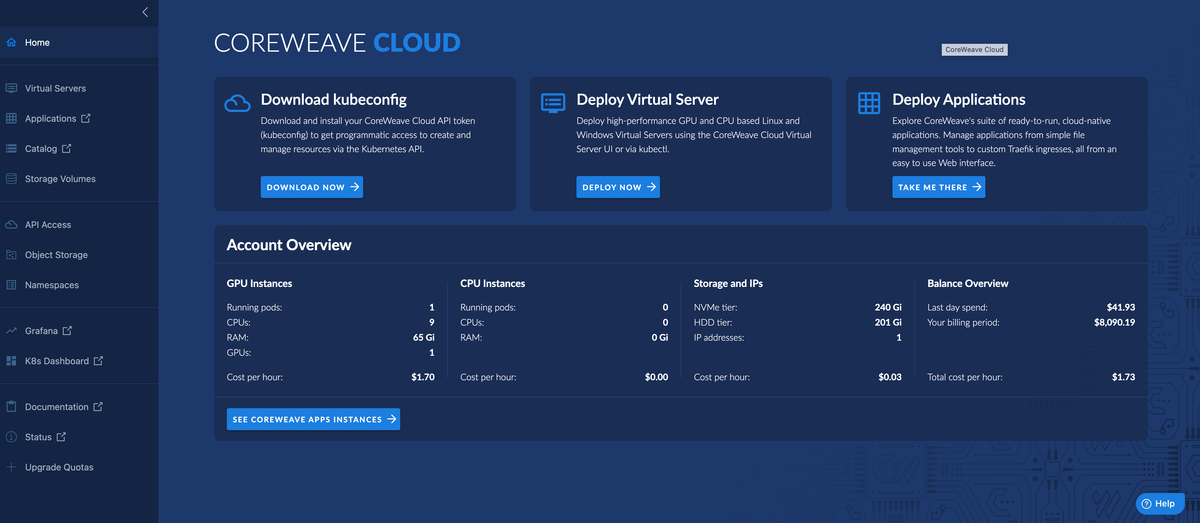
From the main Cloud UI dashboard, a simplified overview of the organization's current statistics is displayed at the bottom of the page, which includes resource usage and billing information.
The three panels at the top of the page allow for quick navigation to the most popular dashboards:
- Download
kubeconfig: From here, organization administrators may easily navigate to set up a Kubeconfig file or generate an API token. - Deploy Virtual Server: Any member of the organization may navigate here to deploy a Virtual Server.
- Deploy Applications: Any member of the organization may navigate here to deploy a new application from the CoreWeave Applications Catalog.
All other dashboards are accessed using the navigation on the lefthand navigation:
| Dashboard Area | Description |
|---|---|
| Virtual Servers | Create and manage Virtual Servers |
| Applications | View all applications currently installed in the namespace |
| Catalog | View all applications available to deploy onto CoreWeave Cloud |
| Storage Volumes | Create and manage storage volumes, request quota increases |
| API Access | Create and manage kubeconfig files and API access tokens |
| Object Storage | Create and manage Object Storage endpoints, request quota increases |
| Namespaces | Create and manage existing namespaces, request quota increases |
| Grafana | Redirects to the Grafana dashboard for the organization |
| Documentation | Redirects to this site; docs.coreweave.com |
| Status | Redirects to status.coreweave.com |
| Upgrade Quotas | Opens a quota increase request |
Virtual Servers
.9f0b93a.1200.png)
Virtual Servers are specialized virtual machines, configurable and deployable entirely through the Cloud UI's Web interface. Virtual Servers leverage the bare metal performance of CoreWeave Cloud for applications in machine learning, VFX rendering, or as Virtual Workstations.
Virtual Servers are configured, deployed, and managed from the Virtual Servers dashboard.
Applications
The applications dashboard displays all applications currently installed in the organization's namespace. From this dashboard, users may also check the status of applications, edit an application's deployment configuration, or delete a deployed application.
Catalog
.0dcfc5e.1200.png)
The CoreWeave Cloud Applications Catalog is a built-in catalog featuring many useful applications, which can be deployed and ready to use in just a few clicks.
Storage Volumes
.0a02a33.1200.png)
High-performance, network-attached storage volumes for containerized custom applications and for Virtual Servers are easy to provision and manage from the Storage Volumes dashboard.
Storage Volumes are available in both all-NVMe and HDD tiers, and can be created as Block Volumes or Shared File System Volumes. Storage Volumes can be resized at any time, and because storage resources are managed separately from compute, they can be moved between instances and between hardware types.
Quota increase requests may also be submitted here, by clicking the Increase Quota button at the top right.
API Access
.573e5e5.1200.png)
From the API Access page, organization administrators may generate new API access tokens and new Kubeconfig files to allow organization members access to the namespace and the resources deployed within it.
Object Storage
.99002a1.1200.png)
CoreWeave Object Storage is an S3-compatible storage system that allows data to be stored and retrieved in a flexible and efficient way. From the Object Storage dashboard, new Object Storage tokens are generated and managed to configure authentication and access levels to Object Storage buckets.
Namespaces
.b1ba08b.1200.png)
Each organization on CoreWeave Cloud may have one or multiple namespaces, which are managed from the Namespaces dashboard.
This list displays the current state of all namespaces within the organization, and includes information such as the number of GPUs in use, the number of Pods running in the namespace, the number of Virtual Servers deployed to the namespace, and the amount of storage capacity in each namespace.
Quota increase requests may also be submitted from this dashboard. Click the ellipses on the right-hand side of the namespace, and select Request Quota Increase.
.55cd087.1200.png)
Change the active namespace
By default, the Cloud UI's active namespace is set to the first one that was created, but the active namespace may be selected from the top of any page within the Cloud UI. To set your active workspace to a different namespace, click the Active Namespace dropdown selector in the upper right-hand corner of the current page, then select the desired namespace.
.77971a1.1200.png)
Grafana
This link redirects to the organization's Grafana metrics page, providing an in-depth view of the organization's infrastructure. The predefined dashboards offer detailed reports of the GPUs, CPUs, memory, and network activity for each Pod, along with compute and storage summaries.
CoreWeave provides a managed Grafana instance to view predefined dashboards with compute and storage summaries, and detailed reports of the GPUs, CPUs, memory, and network activity for each Pod.
The predefined dashboards cannot be cannot modified, or new ones created. For complete control, see our self-hosted Grafana guide.
Documentation
You are here! This link redirects to docs.coreweave.com.
Status
This link redirects to the status page for CoreWeave's systems, status.coreweave.com.
Upgrade quotas
This link opens a quota increase request.
.af7b46f.898.png)
Quota increase requests may be submitted for number of Pods, number of GPUs, storage capacity, or Object Storage capacity for the given namespace. Object Storage capacity increase requests may be approved by organization admins from the admin console.