> ## Documentation Index
> Fetch the complete documentation index at: https://docs.coreweave.com/llms.txt
> Use this file to discover all available pages before exploring further.
# Billing insights
> View billable usage, measured usage, and exclusions by resource type and capacity plan in the Cloud Console
The **Billing insights** page in the Cloud Console is a built-in view that helps you understand billable usage, how it compares to total measured usage, and where exclusions apply across your workloads. Use it to audit your invoice, verify how exclusions affect your charges, or identify usage trends across clusters and zones.
To open the page, go directly to [Billing insights](https://console.coreweave.com/billing/insights), or log in to the Cloud Console and navigate to **Administration** > **Billing** > **Billing insights**.
The page organizes the same billable usage into two tabs:
* **Usage by resource type** breaks usage down by GPU, CPU, storage, and network.
* **Usage by capacity plan** breaks GPU and CPU usage down by [capacity plan](/platform/capacity-plans): Reserved Instances, On-Demand, Spot, and Flex.
Both tabs share the same date range. The **Cluster** and **Zone** filters apply only to the **Usage by resource type** tab.
## Permissions
The Cloud Console only displays the **Billing insights** page if you have the required role. The following role or legacy group allows access:
* The `Billing Viewer` role in an [IAM Access Policy](/security/iam/access-policies)
* The legacy `billing_viewer` group
An organization administrator can assign roles to other users. To manage permissions, see [User Permissions](/security/authn-authz/manage-users).
## Filters and date range
At the top of the page you can scope and filter the data:
* **Cluster** and **Zone** dropdowns to limit usage to specific infrastructure. Both dropdowns are available only on the **Usage by resource type** tab. The date range applies to both tabs.
* **Date range picker** with quick options: **MTD** (Month to date), **Last 7 days**, **Last 30 days**, and **Last month** (the previous calendar month).
* A note showing the billing day window (for example, "Billing day runs from 5:00 PM to 5:00 PM ET").
## Usage by resource type
On the **Usage by resource type** tab, usage is grouped into four resource categories, each displayed as a collapsible card:
| Resource type | Unit |
| ------------- | -------------- |
| **GPUs** | instance-hours |
| **CPUs** | instance-hours |
| **Storage** | GiB-hours |
| **Network** | address-hours |
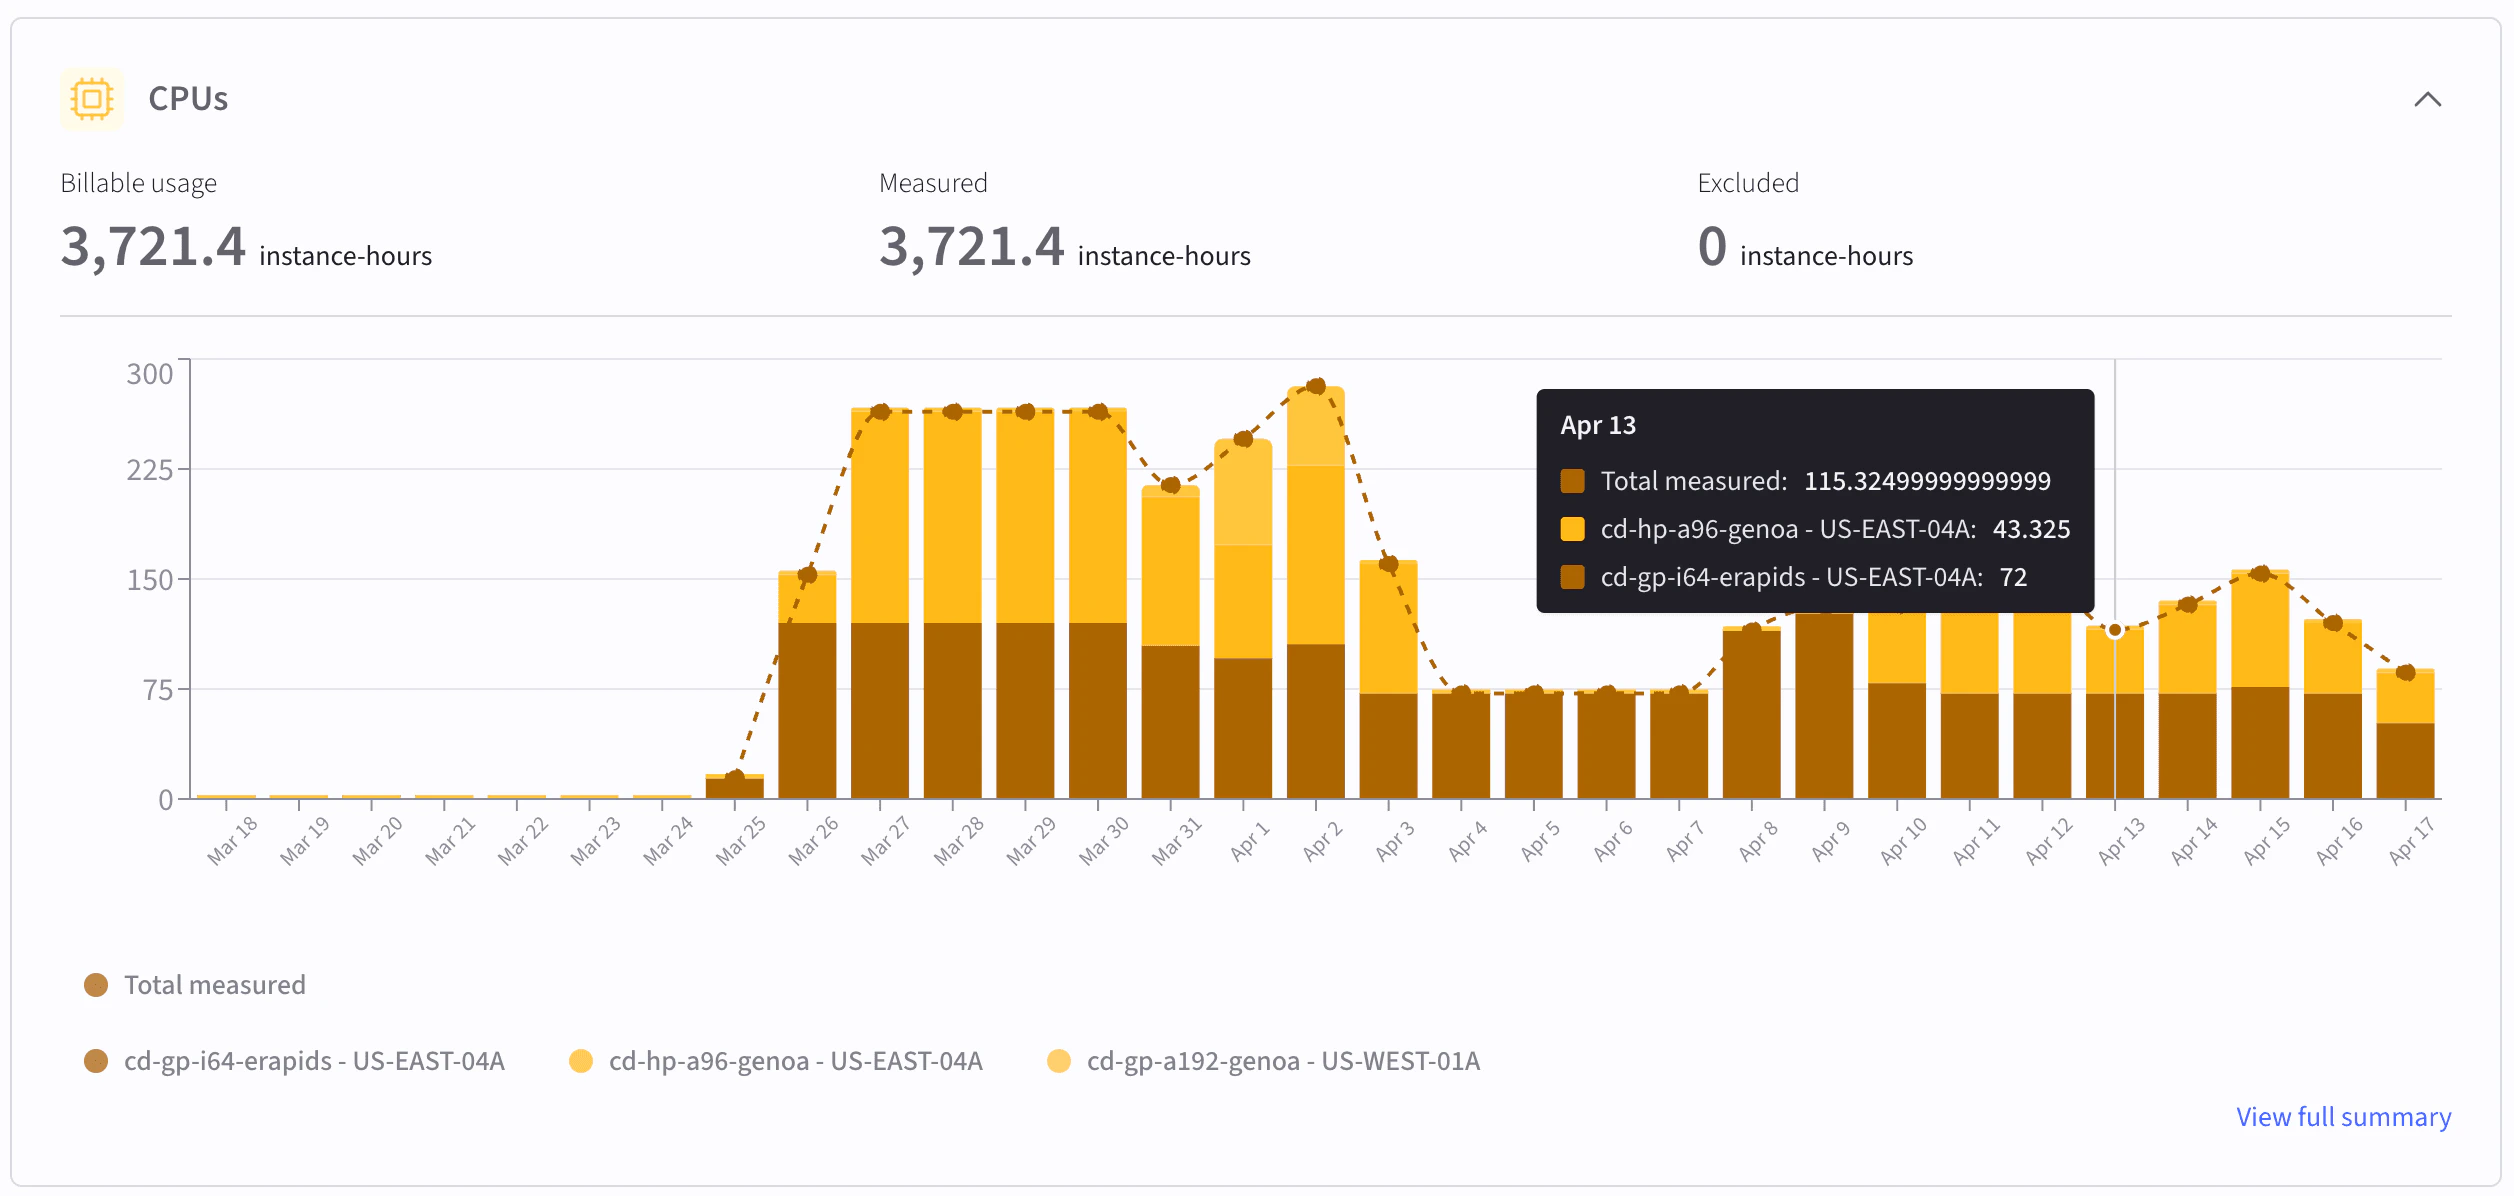
### Resource cards
Expanding a resource card reveals three metrics for the selected time period:
* **Billable usage**: The amount that appears on your invoice, after exclusions.
* **Measured usage**: Total metered usage before any exclusions are applied.
* **Excluded**: The portion of measured usage removed from billing, shown in both absolute units and as a percentage of measured usage.
Below the metrics, a stacked bar chart shows billable usage over time, broken down by SKU. A dotted trend line shows total measured usage for comparison. The legend lists each SKU and zone combination.
Select **View full summary** within a card to see a detailed breakdown for that resource type.
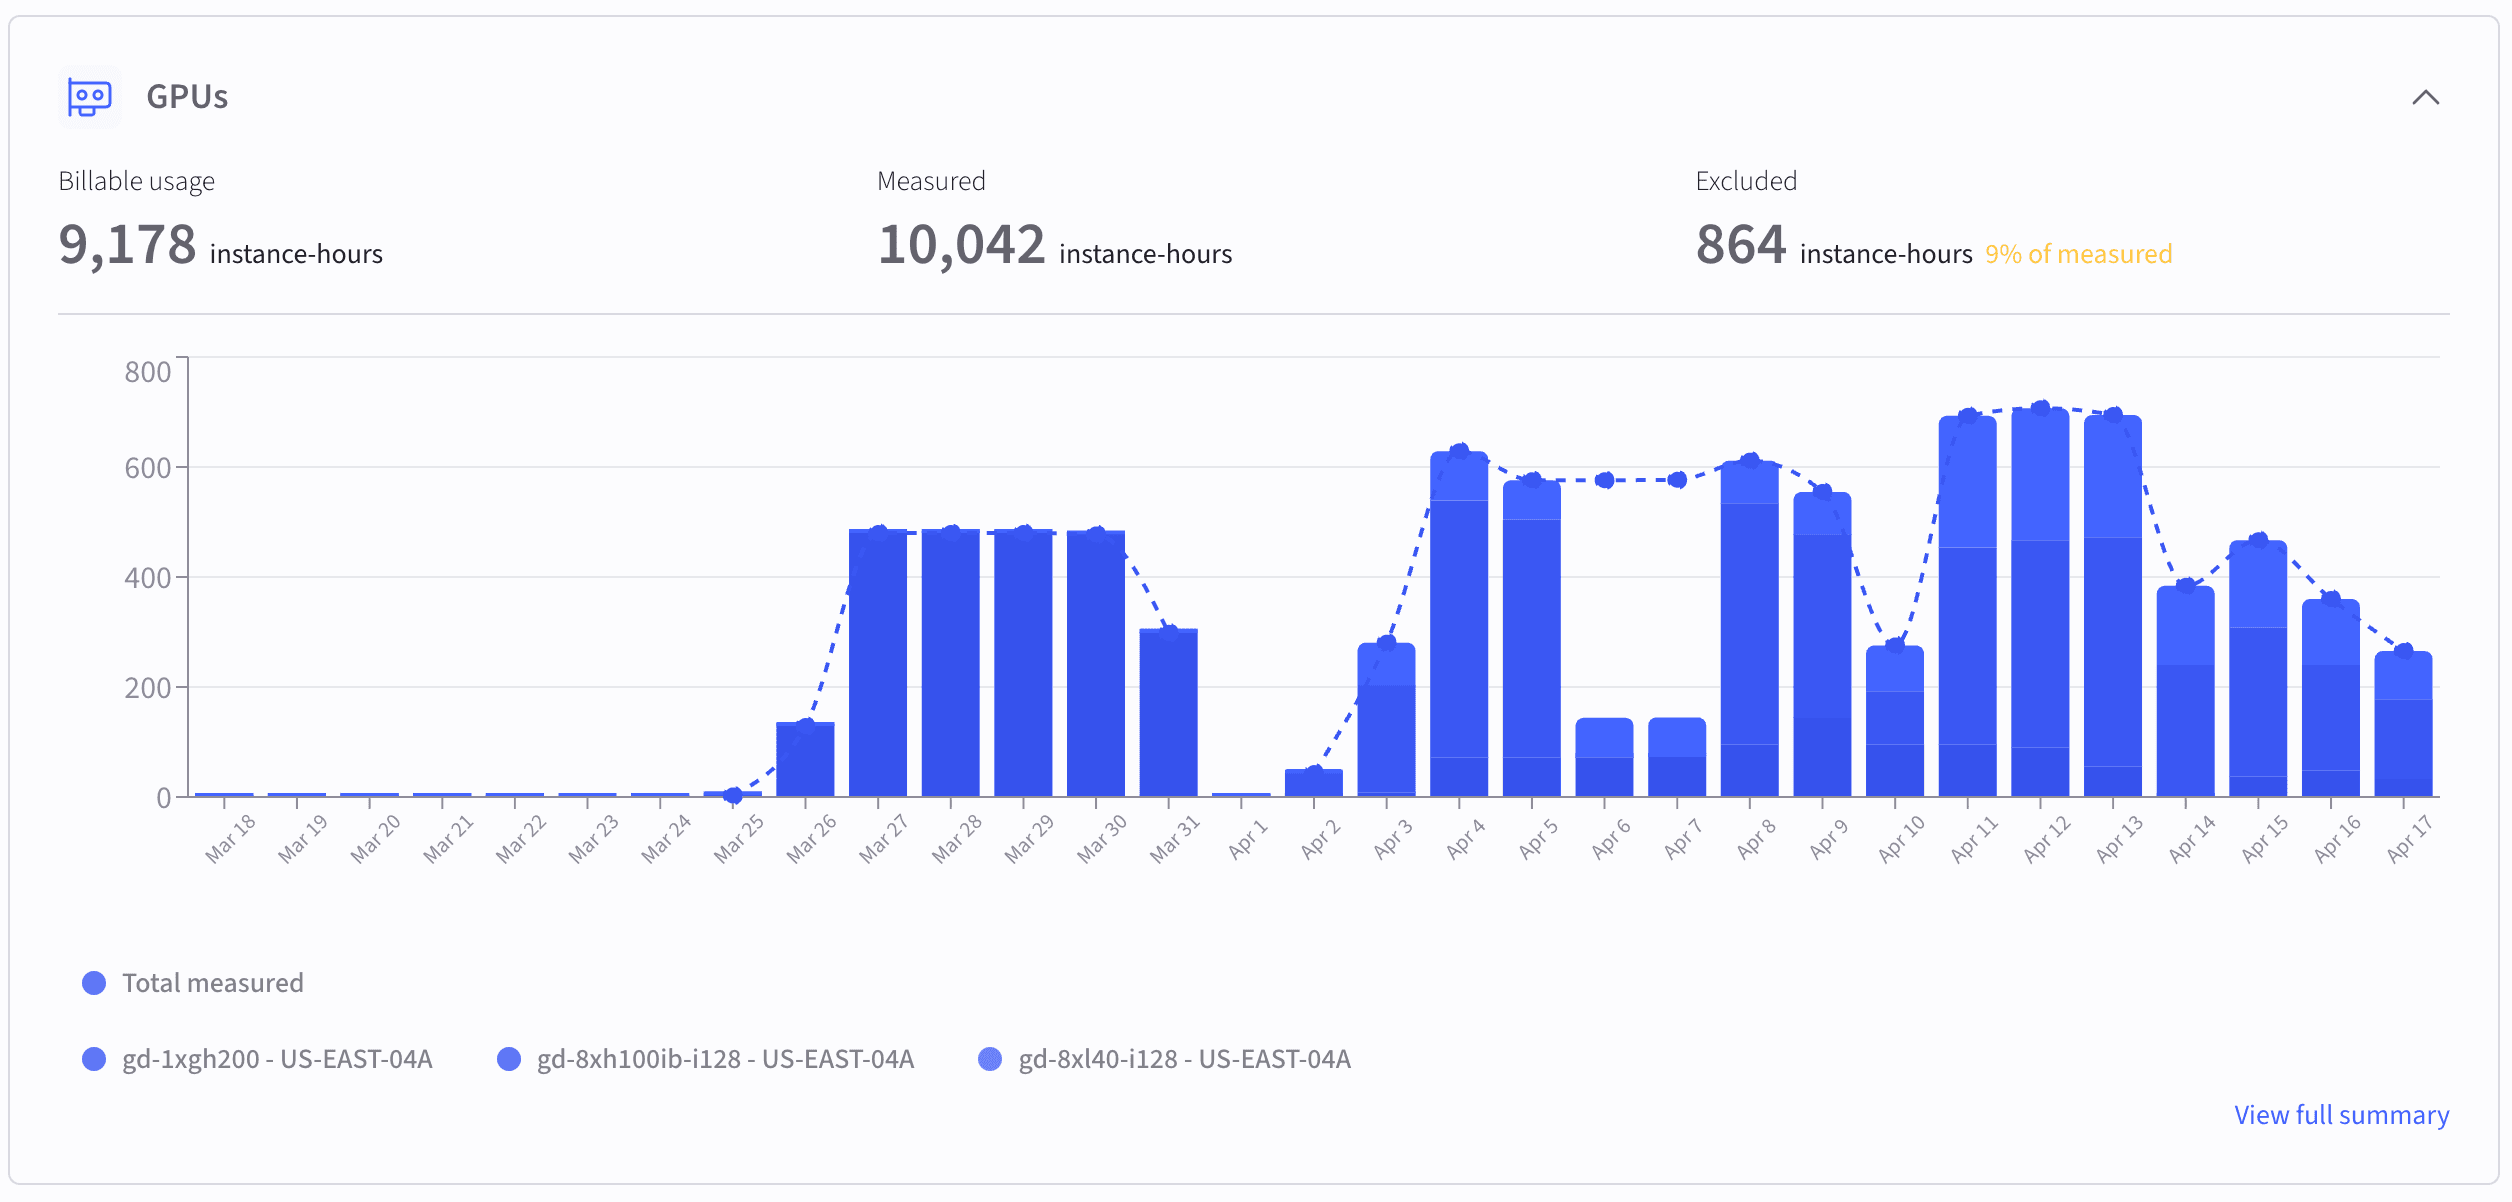 Hover over the chart to see per-day, per-SKU breakdowns and which portion of usage was excluded versus billable.
 ### Product exclusions summary
The **Product exclusions summary** table at the bottom of the page shows a row for each exclusion applied during the selected time range:
| Column | Description |
| -------------------- | ------------------------------------------------------------ |
| **Product** | The SKU or product to which the exclusion applies |
| **Type** | The resource category (GPU, CPU, Storage, or Network) |
| **Measured** | Total measured usage for that product in the selected period |
| **Excluded** | The amount of measured usage excluded from billing |
| **Billable** | The remaining usage that is billable after exclusions |
| **Exclusion reason** | Why the exclusion was applied |
| **Percent excluded** | The fraction of measured usage that was excluded |
All values are scoped to the currently selected environment, clusters, zones, and time range. Changing any filter recalculates the totals and charts.
Exclusions are visible only after they have been configured and applied by CoreWeave. If you expect an exclusion and don't see it, contact support or your account team.
## Usage by capacity plan
The **Usage by capacity plan** tab groups your billable GPU and CPU usage by capacity plan instead of by resource type. Use it to see how your consumption is distributed across Reserved Instances, On-Demand, Spot, and Flex for the selected period.
This tab uses the same date range as the Usage by resource type tab. The **Cluster** and **Zone** filters don't apply here. The tab has three sections: summary cards, usage charts, and a breakdown by product.
### Summary cards
The tab shows one card per capacity plan: **Reserved instance**, **On-demand**, **Spot**, and **Flex**. Each card reports, for the selected period:
* **GPU** billable hours and their percentage of the GPU total across all plans.
* **CPU** billable hours and their percentage of the CPU total across all plans.
The **Reserved instance** and **On-demand** cards always show metrics, even at zero hours. The **Spot** and **Flex** cards instead show an empty state when you have no GPU or CPU usage under that plan. Each empty state includes a short description of the plan and a **Learn more in the docs** link: the **Spot** card links to [Spot Node Pools](/platform/capacity-plans/spot-node-pools), and the **Flex** card links to [Flex Reservations](/platform/capacity-plans#flex-reservations). The **Spot** card also links to [Capacity Finder](/platform/capacity-plans/capacity-finder) to search for Spot capacity, and the **Flex** card prompts you to contact your Account Executive or Solutions Architect to add Flex to your capacity plan.
### Usage charts
Two stacked bar charts show daily billable instance-hours, broken down by capacity plan:
* **GPU usage by capacity plan**: daily billable GPU instance-hours stacked by plan.
* **CPU usage by capacity plan**: daily billable CPU instance-hours stacked by plan.
The legend is interactive. Select a plan name to toggle its series on or off in the chart.
### Breakdown by product
The **Breakdown by product** table lists total billable hours per SKU across all capacity plans for the selected period:
| Column | Description |
| --------------------- | ------------------------------------------------------- |
| **Product** | The SKU or product |
| **Type** | The resource category (GPU, CPU, Storage, or Network) |
| **Reserved instance** | Billable hours attributed to a Reserved Instance |
| **On-demand** | Billable hours attributed to On-Demand |
| **Spot** | Billable hours attributed to Spot |
| **Flex** | Billable hours attributed to a Flex Reservation |
| **Total** | The sum of billable hours across all plans for that SKU |
You can sort the table by any column.
For details on how usage is attributed across plans, including the order in which Reserved Instance, Flex, and On-Demand capacity is filled, see [About capacity plans](/platform/capacity-plans).
## Key concepts
The following concepts describe the metrics used throughout this page.
**Measured usage** is the raw metered consumption for a given resource and SKU over the selected time window. This is the **Total measured** series shown in the charts.
**Billable usage** is the portion of measured usage that appears on your invoice. It equals measured usage minus any exclusions.
**Excluded usage** is usage that was measured but explicitly removed from billing, for example for a proof of concept, a credit, or a make-good. The Product exclusions summary table shows the line-item details for each exclusion, including the reason and the percentage of measured usage that was excluded.
## Related resources
The following resources provide additional context for billing and access management:
* The Grafana dashboard [Usage by Product and Zone](/observability/managed-grafana/cost-usage/usage-product-zone) shows detailed resource consumption metrics.
* The [IAM Access Policies](/security/iam/access-policies) page covers managing user roles and permissions.
### Product exclusions summary
The **Product exclusions summary** table at the bottom of the page shows a row for each exclusion applied during the selected time range:
| Column | Description |
| -------------------- | ------------------------------------------------------------ |
| **Product** | The SKU or product to which the exclusion applies |
| **Type** | The resource category (GPU, CPU, Storage, or Network) |
| **Measured** | Total measured usage for that product in the selected period |
| **Excluded** | The amount of measured usage excluded from billing |
| **Billable** | The remaining usage that is billable after exclusions |
| **Exclusion reason** | Why the exclusion was applied |
| **Percent excluded** | The fraction of measured usage that was excluded |
All values are scoped to the currently selected environment, clusters, zones, and time range. Changing any filter recalculates the totals and charts.
Exclusions are visible only after they have been configured and applied by CoreWeave. If you expect an exclusion and don't see it, contact support or your account team.
## Usage by capacity plan
The **Usage by capacity plan** tab groups your billable GPU and CPU usage by capacity plan instead of by resource type. Use it to see how your consumption is distributed across Reserved Instances, On-Demand, Spot, and Flex for the selected period.
This tab uses the same date range as the Usage by resource type tab. The **Cluster** and **Zone** filters don't apply here. The tab has three sections: summary cards, usage charts, and a breakdown by product.
### Summary cards
The tab shows one card per capacity plan: **Reserved instance**, **On-demand**, **Spot**, and **Flex**. Each card reports, for the selected period:
* **GPU** billable hours and their percentage of the GPU total across all plans.
* **CPU** billable hours and their percentage of the CPU total across all plans.
The **Reserved instance** and **On-demand** cards always show metrics, even at zero hours. The **Spot** and **Flex** cards instead show an empty state when you have no GPU or CPU usage under that plan. Each empty state includes a short description of the plan and a **Learn more in the docs** link: the **Spot** card links to [Spot Node Pools](/platform/capacity-plans/spot-node-pools), and the **Flex** card links to [Flex Reservations](/platform/capacity-plans#flex-reservations). The **Spot** card also links to [Capacity Finder](/platform/capacity-plans/capacity-finder) to search for Spot capacity, and the **Flex** card prompts you to contact your Account Executive or Solutions Architect to add Flex to your capacity plan.
### Usage charts
Two stacked bar charts show daily billable instance-hours, broken down by capacity plan:
* **GPU usage by capacity plan**: daily billable GPU instance-hours stacked by plan.
* **CPU usage by capacity plan**: daily billable CPU instance-hours stacked by plan.
The legend is interactive. Select a plan name to toggle its series on or off in the chart.
### Breakdown by product
The **Breakdown by product** table lists total billable hours per SKU across all capacity plans for the selected period:
| Column | Description |
| --------------------- | ------------------------------------------------------- |
| **Product** | The SKU or product |
| **Type** | The resource category (GPU, CPU, Storage, or Network) |
| **Reserved instance** | Billable hours attributed to a Reserved Instance |
| **On-demand** | Billable hours attributed to On-Demand |
| **Spot** | Billable hours attributed to Spot |
| **Flex** | Billable hours attributed to a Flex Reservation |
| **Total** | The sum of billable hours across all plans for that SKU |
You can sort the table by any column.
For details on how usage is attributed across plans, including the order in which Reserved Instance, Flex, and On-Demand capacity is filled, see [About capacity plans](/platform/capacity-plans).
## Key concepts
The following concepts describe the metrics used throughout this page.
**Measured usage** is the raw metered consumption for a given resource and SKU over the selected time window. This is the **Total measured** series shown in the charts.
**Billable usage** is the portion of measured usage that appears on your invoice. It equals measured usage minus any exclusions.
**Excluded usage** is usage that was measured but explicitly removed from billing, for example for a proof of concept, a credit, or a make-good. The Product exclusions summary table shows the line-item details for each exclusion, including the reason and the percentage of measured usage that was excluded.
## Related resources
The following resources provide additional context for billing and access management:
* The Grafana dashboard [Usage by Product and Zone](/observability/managed-grafana/cost-usage/usage-product-zone) shows detailed resource consumption metrics.
* The [IAM Access Policies](/security/iam/access-policies) page covers managing user roles and permissions.